


IPCC and the “Trick”
Steve McIntyre
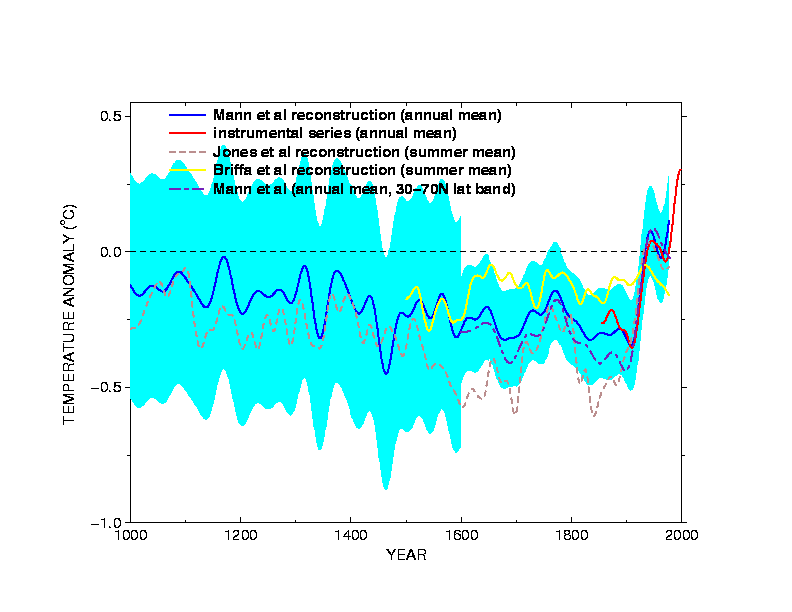
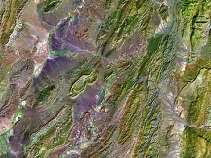
[Click on image to enlarge.] [Figure 1. IPCC Third Assessment Report Zero-Order Draft Figure 2.3.3a Comparison of millennial Northern Hemisphere (NH) temperature reconstructions from different investigators (Briffa et al, 1998; Jones et al, 1998; Mann et al, 1998;1999a)… All the series were filtered with a 40 year Gaussian filter. The problematic Briffa reconstruction is the yellow series.]
Much recent attention has been paid to the email about the “trick” and the effort to “hide the decline”. Climate scientists have complained that this email has been taken “out of context”. In this case, I’m not sure that it’s in their interests that this email be placed in context because the context leads right back to a meeting of IPCC authors in Tanzania, raising serious questions about the role of IPCC itself in “hiding the decline” in the Briffa reconstruction.
Relevant Climategate correspondence in the period (September-October 1999) leading up to the trick email is incomplete, but, in context, is highly revealing. There was a meeting of IPCC lead authors between Sept 1-3, 1999 to consider the “zero-order draft” of the Third Assessment Report. The emails provide clear evidence that IPCC had already decided to include a proxy diagram reconstructing temperature for the past 1000 years and that a version of the proxy diagram was presented at the Tanzania meeting showing the late twentieth century decline. I now have a copy of the proxy diagram presented at this meeting (see below).
The emails show that the late 20th century decline in the Briffa reconstruction was perceived by IPCC as “diluting the message”, that “everyone in the room at IPCC” thought that the Briffa decline was a “problem” and a “potential distraction/detraction”, that this was then the “most important issue” in chapter 2 of the IPCC report and that there was “pressure” on Briffa and other authors to show a “nice tidy story” of “unprecedented warming in a thousand years or more”.
The chronology in today’s posts show that the version of the Briffa reconstruction shown in the subsequent proxy diagram in the IPCC “First Order Draft” (October 27, 1999), presumably prepared under the direction of IPCC section author Mann, deleted the inconvenient portion (post-1960) of the Briffa reconstruction, together with other modifications that had the effect of not “diluting the message”. About two weeks later (Nov 16, 1999) came the now infamous Jones email reporting the use of “Mike’s Nature trick” to “hide the decline” in a forthcoming WMO (World Meteorological Organization) report. Jones’ methodology is different than the IPCC methodology. Jones’ trick has been described in previous posts. Today, I’ll describe both the context of the IPCC version of the “trick” and progress to date in reverse engineering the IPCC trick.
IPCC Lead Authors’ Meeting, Sept 1999
IPCC Lead Authors met in Arusha, Tanzania from September 1 to 3, 1999 (see Houghton, 929985154.txt and 0938018124.txt), at which the final version of the “zero-order” draft of the Third Assessment Report was presented and discussed. The “First-Order Draft” was sent out to reviewers two months later (end of October 1999).
By this time, IPCC was already structuring the Summary for Policy-makers and a proxy diagram showing temperature history over the past 1000 years was a “clear favourite”.
A proxy diagram of temperature change is a clear favourite for the Policy Makers summary. (Folland, Sep 22, 1999, in 0938031546.txt)
This desire already placed “pressure” on the authors to “present a nice tidy story” about “unprecedented warming in a thousand years”:
I know there is pressure to present a nice tidy story as regards ‘apparent unprecedented warming in a thousand years or more in the proxy data’ …(Briffa, Sep 22, 1999, 0938031546.txt)
The “zero-order” draft (their Figure 2.3.3a as shown below) showed a version of the Briffa reconstruction with little variation and a noticeable decline in the late 20th century.
No minutes of this meeting are available, but Climategate correspondence on Sep 22-23, 1999 provides some contemporary information about the meeting. Mann noted that “everyone in the room at IPCC was in agreement that the [decline in the Briffa reconstruction] was a problem”:
Keith’s series… differs in large part in exactly the opposite direction that Phil’s does from ours. This is the problem we all picked up on (everyone in the room at IPCC was in agreement that this was a problem and a potential distraction/detraction from the reasonably concensus viewpoint we’d like to show w/ the Jones et al and Mann et al series. (Mann, Sep 22, 1999, 0938018124.txt)
IPCC Chapter Author Folland of the U.K. Hadley Center wrote to Mann, Jones and Briffa that the proxy diagram was a “clear favourite” for the Summary Policy-makers, but that the existing presentation showing the decline of the Briffa reconstruction “dilutes the message rather significantly”:
A proxy diagram of temperature change is a clear favourite for the Policy Makers summary. But the current diagram with the tree ring only data [i.e. the Briffa reconstruction] somewhat contradicts the multiproxy curve and dilutes the message rather significantly… This is probably the most important issue to resolve in Chapter 2 at present.. (Folland, Sep 22, 1999, in 0938031546.txt)
After telling the section authors about the stone in his shoe, Folland added that he only “wanted the truth”.
Climategate Letters, Sep 22-23, 1999
The Climategate Letters contain a flurry of correspondence between Mann, Briffa, Jones and Folland (copy to Tom Karl of NOAA) on Sep 22-23, 1999, shedding light on how the authors responded to the stone in IPCC’s shoe. By this time, it appears that each of the three authors (Jones, Mann and Briffa) had experimented with different approaches to the “problem” of the decline.
Jones appears to have floated the idea of using two different diagrams – one without the inconvenient Briffa reconstruction (presumably in the Summary for Policy-makers) and one with the Briffa reconstruction (presumably in the relevant chapter). Jones said that this might make it “somewhat awkward for the reader trying to put them into context”, with it being unclear whether Jones viewed this as an advantage or disadvantage:
If we go as is suggested then there would be two diagrams – one simpler one with just Mann et al and Jones et al and in another section Briffa et al. This might make it somewhat awkward for the reader trying to put them into context. (Jones, Sep 22, 1999 Jones 093801949)
Another approach is perhaps evidenced in programming changes a week earlier (Sep 13-14, 1999), in which programs in the osborn-tree6/mann/oldprog directory appear to show efforts to “correct” the calibration of the Briffa reconstruction, which may or may not be relevant to the eventual methodology to “hide the decline”.
The correspondence implies (though this is at present not proven) that IPCC section author Mann’s first reaction to the “problem” was to totally delete the Briffa reconstruction from the proxy diagram, as the correspondence of September 22 seems to have been precipitated by Briffa being unhappy at an (unseen) version of the proxy diagram in which his reconstruction had been deleted.
Briffa’s length email of Sep. 22, 19990 (938031546.txt) should be read in full. Briffa was keenly aware of the pressure to present a “nice tidy story” of “unprecedented warming”, but is worried about the proxy evidence:
I know there is pressure to present a nice tidy story as regards ‘apparent unprecedented warming in a thousand years or more in the proxy data’ but in reality the situation is not quite so simple… [There are] some unexpected changes in response that do not match the recent warming. I do not think it wise that this issue be ignored in the chapter. (Briffa, Sep 22, 1999, 0938031546.txt)
He continued:
For the record, I do believe that the proxy data do show unusually warm conditions in recent decades. I am not sure that this unusual warming is so clear in the summer responsive data. I believe that the recent warmth was probably matched about 1000 years ago. I do not believe that global mean annual temperatures have simply cooled progressively over thousands of years as Mike appears to and I contend that that there is strong evidence for major changes in climate over the Holocene (not Milankovich) that require explanation and that could represent part of the current or future background variability of our climate. (Briffa, Sep 22, 1999, 0938031546.txt)
Thus, when Mann arrived at work on Sep 22, 1999, Mann observed that he had walked into a “hornet’s nest”. (Mann Sep 22, 1999, 0938018124.txt). In an effort to resolve the dispute, Mann said that (subject to the agreement of Chapter Authors Karl and Folland) he would add back Briffa’s reconstruction, but pointed out that this would present a “conundrum”:
So if Chris[Folland] and Tom [Karl] are ok with this, I would be happy to add Keith’s series. That having been said, it does raise a conundrum: We demonstrate … that the major discrepancies between Phil’s and our series can be explained in terms of spatial sampling/latitudinal emphasis … But …Keith’s series… differs in large part in exactly the opposite direction that Phil’s does from ours. This is the problem we all picked up on (everyone in the room at IPCC was in agreement that this was a problem and a potential distraction/detraction from the reasonably concensus viewpoint we’d like to show w/ the Jones et al and Mann et al series. (Mann Sep 22, 0938018124.txt
Mann went on to say that the skeptics would have a “field day” if the declining Briffa reconstruction were shown and that he’d “hate to be the one” to give them “fodder”:
So, if we show Keith’s series in this plot, we have to comment that “something else” is responsible for the discrepancies in this case.…Otherwise, the skeptics have an field day casting doubt on our ability to understand the factors that influence these estimates and, thus, can undermine faith in the paleoestimates. I don’t think that doubt is scientifically justified, and I’d hate to be the one to have to give it fodder! (Mann Sep 22, 0938018124.txt)
By the following day, matters seem to have settled down, with Briffa apologizing to Mann for his temporary pangs of conscience. On Oct 5, 1999, Osborn (on behalf of Briffa) sent Mann a revised version of the Briffa reconstruction with more “low-frequency” variability (Osborn, Oct 5, 1999, 0939154709.txt), a version that is identical up to 1960, this version is identical to the digital version archived at NCDC for Briffa et al (JGR 2001). (The post-1960 values of this version were not “shown” in the version archived at NCDC; they were deleted.)
As discussed below, this version had an even larger late-20th century decline than the version shown at the Tanzania Lead Authors’ meeting. Nonetheless, the First Order Draft (Oct 27, 1999) sent out a few weeks later contained a new version of the proxy diagram (Figure 2.25), a version which contains the main elements of the eventual Third Assessment Report proxy diagram (Figure 2.21). Two weeks later came Jones’ now infamous “trick” email (0942777075.txt).
The IPCC Trick
Mann’s IPCC trick is related to the Jones’ trick, but different. (The Jones trick has been explained in previous CA posts here, here and consists of replacing the tree ring data with temperature data after 1960 – thereby hiding the decline – and then showing the smoothed graph as a proxy reconstruction.) While some elements of the IPCC Trick can be identified with considerable certainty, other elements are still somewhat unclear.
The diagram below shows the IPCC version of the Briffa reconstruction (digitized from the IPCC 2001) compared to actual Briffa data from the Climategate email of October 5, 1999, smoothed using the methodology said to have been used in the caption to the IPCC figure (a 40 year Hamming filter with end-point padding with the mean of the closing 20 years).
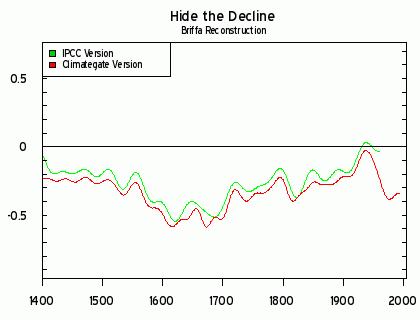
[Figure 3. Versions of the Briffa Reconstruction in controversy, comparing the original data smoothed according to the reported methodology to a digitization of the IPCC version.]
Clearly, there are a number of important differences between the version sent to Mann and the version that appeared in the IPCC report. The most obvious is, of course, that the decline in the Briffa reconstruction has, for the most part, been deleted from the IPCC proxy diagram. However, there are some other frustrating inconsistencies and puzzles that are all too familiar.
There are some more technical inconsistencies that I’ll record for specialist readers. It is very unlikely that that the IPCC caption is correct in stating that a 40-year Hamming filter was used. Based on comparisons of the MBH reconstruction and Jones reconstruction, as well as the Briffa reconstruction, to versions constructed from raw data, it appears that a Butterworth filter was used – a filter frequently used in Mann’s subsequent work (a detail that, in addition, bears on the authorship of the graphic itself).
Second, the IPCC caption stated that “boundary constraints imposed by padding the series with its mean values during the first and last 25 years.” Again, this doesn’t seem to reconcile with efforts to replicate the IPCC version from raw data. It appears far more likely to me that each of the temperature series has been padded with instrumental temperatures rather than the mean values of the last 25 years.
Finally, there are puzzling changes in scale. The underlying annual data for the Jones and Briffa reconstructions are expressed in deg C (basis 1961-1990) and should scale simply to the smoothed version in the IPCC version, but don’t quite. This may partly derive from errors introduced in digitization, but is a loose end in present replication efforts.
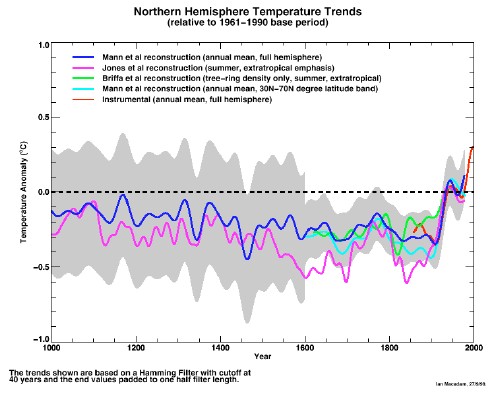
The final IPCC diagram (2.21) is shown below. In this rendering, the Briffa reconstruction is obviously no longer “a problem and a potential distraction/detraction”and does not “dilute the message”. Mann has not given any “fodder” to the skeptics, who obviously did not have a “field day” with the decline.
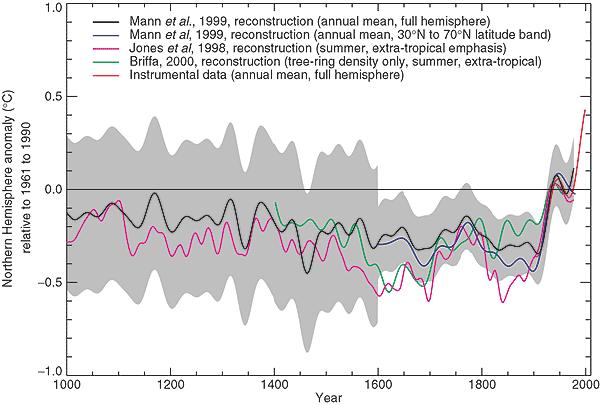
[IPCC Third Assessment Report Figure 2.21: Comparison of warm-season (Jones et al., 1998) and annual mean (Mann et al., 1998, 1999) multi-proxy-based and warm season tree-ring-based (Briffa, 2000) millennial Northern Hemisphere temperature reconstructions. The recent instrumental annual mean Northern Hemisphere temperature record to 1999 is shown for comparison. Also shown is an extra-tropical sampling of the Mann et al. (1999) temperature pattern reconstructions more directly comparable in its latitudinal sampling to the Jones et al. series. The self-consistently estimated two standard error limits (shaded region) for the smoothed Mann et al. (1999) series are shown. The horizontal zero line denotes the 1961 to 1990 reference period mean temperature. All series were smoothed with a 40-year Hamming-weights lowpass filter, with boundary constraints imposed by padding the series with its mean values during the first and last 25 years.]
Contrary to claims by various climate scientists, the IPCC Third Assessment Report did not disclose the deletion of the post-1960 values. Nor did it discuss the “divergence problem”. Yes, there had been previous discussion of the problem in the peer-reviewed literature (Briffa et al 1998) – a point made over and over by Gavin Schmidt and others. But it was not made in the IPCC Third Assessment Report. Not only was the deletion of the declining values not reported or disclosed in the IPCC Third Assessment Report, the hiding of the decline was made particularly artful because the potentially dangling 1960 endpoint of the Briffa reconstruction was hidden under other lines in the spaghetti graph as shown in the following blow-up:
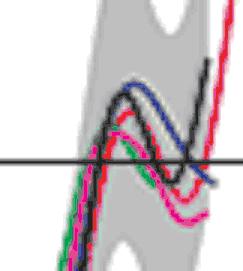
[Figure. Blow-up of IPCC Third Assessment Report Fig 2-21.]
To my knowledge, no one noticed or reported this truncation until my Climate Audit post in 2005 here. The deletion of the decline was repeated in the 2007 Assessment Report First Order and Second Order Drafts, once again without any disclosure. No dendrochronologist recorded any objection in the Review Comments to either draft. As a reviewer of the Second Order Draft, I asked the IPCC in the strongest possible terms to show the decline reported at CA here:
Show the Briffa et al reconstruction through to its end; don’t stop in 1960. Then comment and deal with the “divergence problem” if you need to. Don’t cover up the divergence by truncating this graphic. This was done in IPCC TAR; this was misleading. (Reviewer’s comment ID #: 309-18)]
They refused, stating that this would be “inappropriate”, though a short discussion on the divergence was added – a discussion that was itself never presented to external peer reviewers.
Returning to the original issue: climate scientists say that the “trick” is now being taken out of context. The Climategate Letters show clearly that the relevant context is the IPCC Lead Authors’ meeting in Tanzania in September 1999 at which the decline in the Briffa reconstruction was perceived by IPCC as “diluting the message”, as a “problem”, as a “potential distraction/detraction”. A stone in their shoe.
__________________________________________________________________________________
Source: http://climateaudit.org/2009/12/10/ipcc-and-the-trick/
Via: http://wattsupwiththat.com/2009/12/10/counting-cru-tricks/
http://climateaudit.files.wordpress.com/2009/12/fig2-21.gif