


Climate and Human Civilization over the last 18,000 years
Andy May
This document is meant to explain the accompanying poster and expand on the poster’s content. Some references to the images and data shown in the poster are on the poster and others are in the bibliography. I’ve done my best to verify the accuracy of the content by checking multiple sources. When references had different dates for the same event, I chose the most commonly cited date or the date from the most prestigious sources. I considered dates from articles in Nature, Science, the Encyclopedia Britannica, and Steven Mithen’s book 2 to be the most reliable.
Click here for a full sized print (3000 pixels wide, suitable for printing) or choose the PDF below.
Younger Dryas to Present Time Line (PDF)
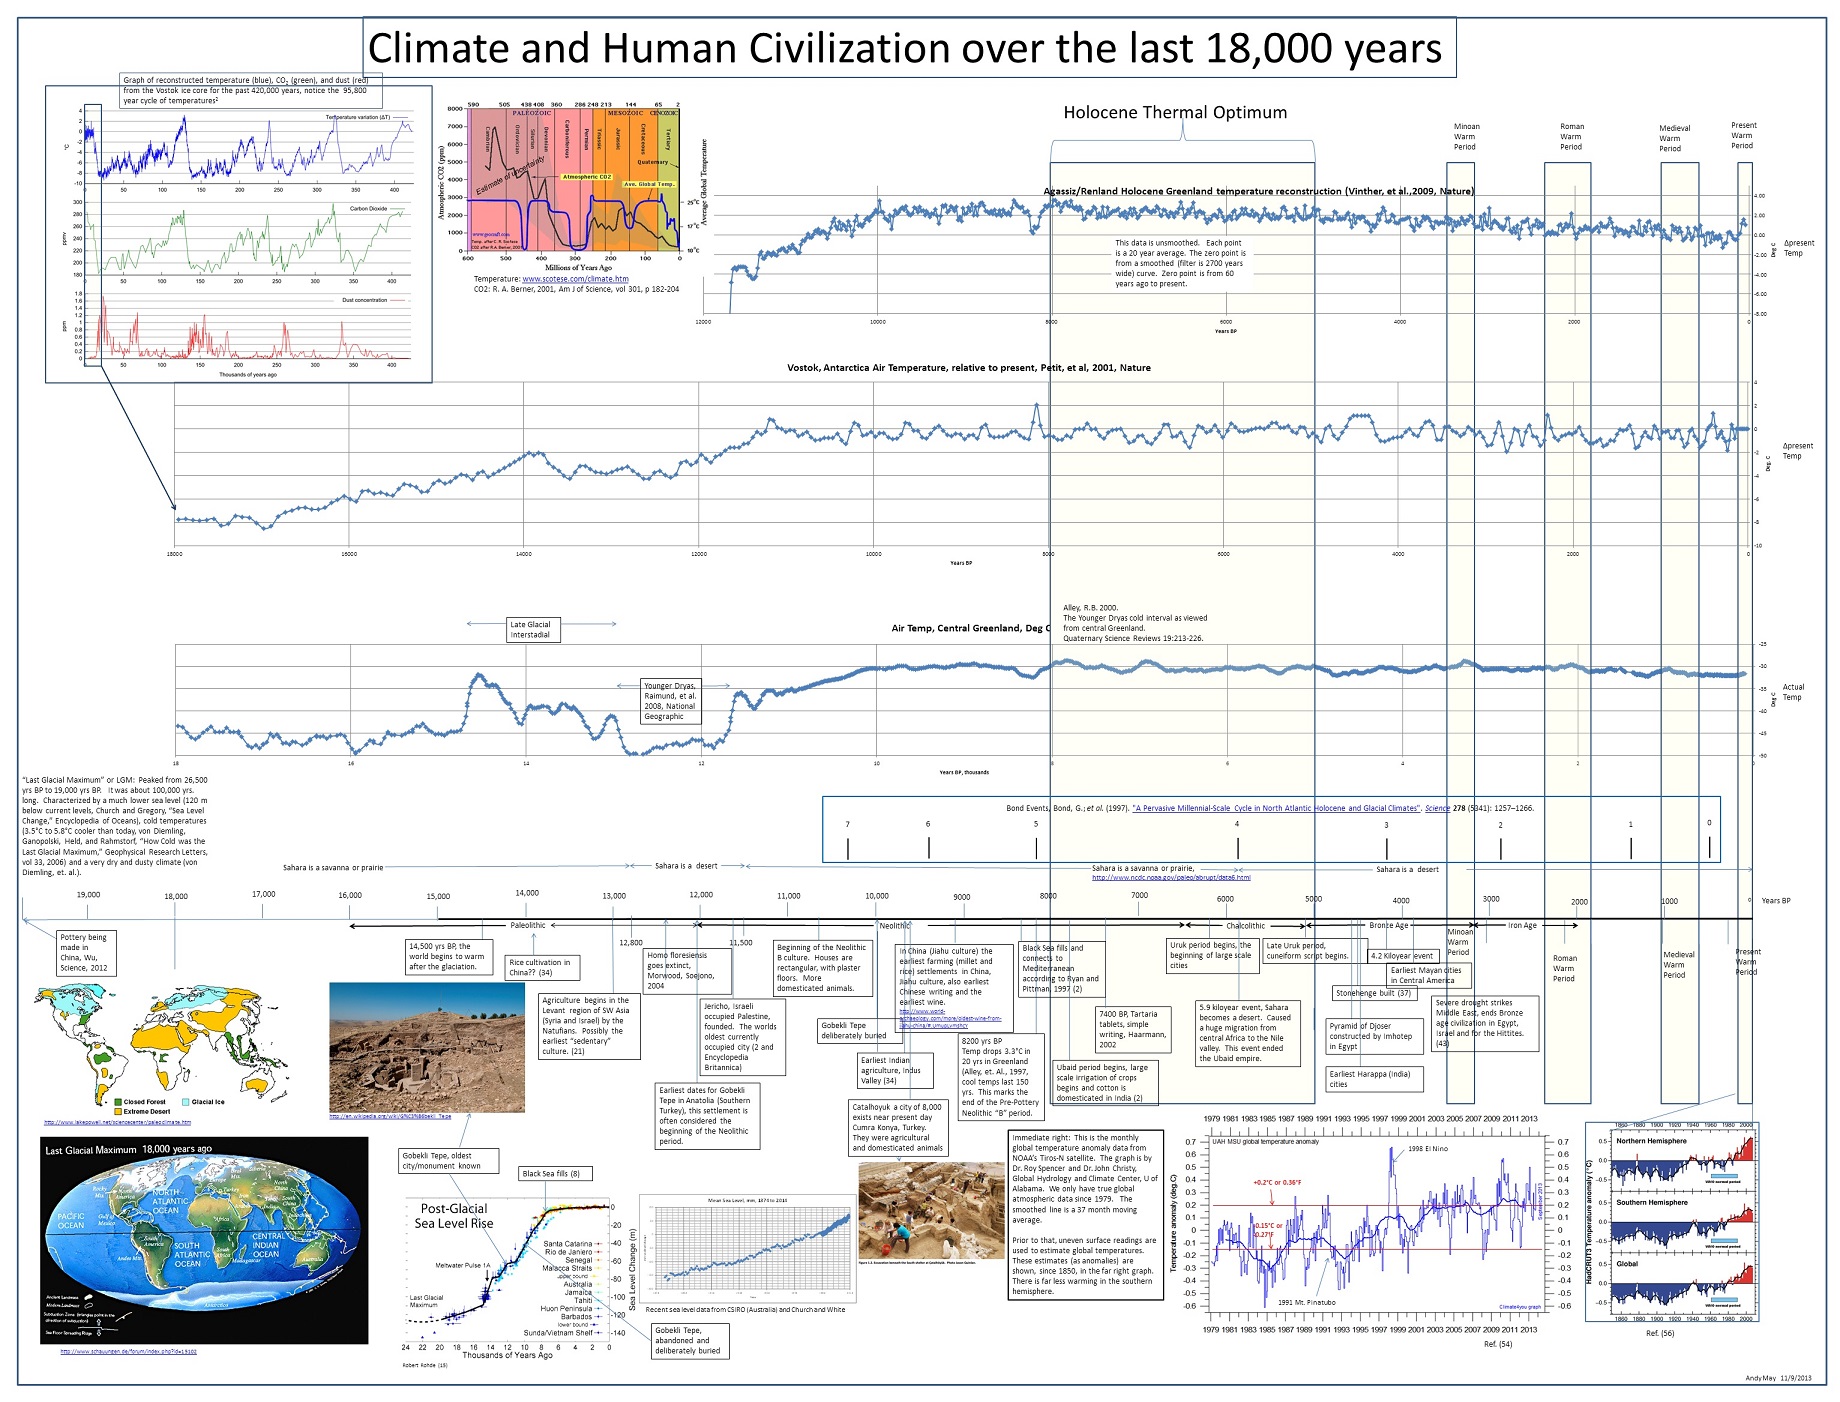
The heart of the poster (above) is a time line that shows the significant documented events in human civilization over the last 18,000 years and documented climatic changes over the same period.
The Last Glacial Maximum (LGM) ended around 19,000 years ago1, and the illustrations on the lower left of the poster illustrate what the world was like then. Much of the land area of the world was under ice or desert at the time, especially in the Northern Hemisphere, and the exposed land had less precipitation than we do today2. As we will see, the cooler climatic events, during the history of civilization, are periods with less precipitation than we observe during warmer times. If there were any organized human civilizations at the time, we have not found any evidence of it, other than some pottery in China, dated to 20,000 years ago 3. Humanity, 20,000 years ago, lived in small communities of a few families and hunted for animals and edible natural vegetation. Domesticated animals (with the possible exception of dogs) and large scale agriculture would not be invented for another 6,000 to 7,000 years 34,21
Dogs were probably domesticated by the Natufians in the Middle East by 14,000 years ago. This seems to be supported by exhumed graves in the ancient villages of Ain Mallah and Hayonium near Lake Tiberias (also called the Sea of Galilee) in Israel. In these graves dogs and humans were deliberately buried together 2. That suggests that they lived and worked together in life. The Natufians collected wild grains, fruits and vegetables and probably cultivated small gardens as early as 14,000 years ago. But, this early, large scale organized farming was unlikely.
The upper part of the poster shows three ice core records. The top record is actually a composite reconstruction of six Greenland ice core records4. The middle chart is the most recent portion of the Vostok Antarctic ice core record, the entire Vostok 400,000 year record is show in the upper left of the poster5. The 95,800 year Milankovitch cycles 2 are very apparent in the Vostok record. These cycles are composed of an overarching 95,800 year cycle where the Earth’s orbit changes from roughly circular (warm and wet climate in the Northern Hemisphere) to elliptical (cold and dry in the Northern Hemisphere) and back again. The elliptical part of this cycle causes the Northern Hemisphere to have stronger seasons and the Southern Hemisphere to have less seasonality; this is what kicks off glacial periods.
Another cycle is when the inclination of the Earth’s axis changes from 21.39 degrees to 24.36 degrees and back again. This cycle is 41,000 years. As the angle increases the seasons become more intense. The Earth also wobbles on its axis in a periodic way. This is a 21,700 year cycle.
You might just be able to see that the middle graph (Carbon Dioxide concentration) slight lags the temperature by about 800 years on average. This suggests that the changes in temperature might cause the Carbon Dioxide changes rather than the other way around. The airborne dust concentration increases when the world is cooler because in the cool periods it is also dryer. 2
Next to the complete Vostok record is a reconstruction of the temperature record for the last 600 million years. Temperatures, today, are lower than they have been for over 250,000,000 years according to this data. The bottom large chart is the actual temperature, calculated from a single central Greenland ice core. 6
Bond Events
Just below the Central Greenland ice core record the “Bond” cooling events over this 18,000 year period are noted7. The Bond cooling events average around 1,500 years apart and some are more dramatic than others. The 8.2, 5.9 and 4.2 kiloyear events were major events 8,9 with dramatic cooling and they were huge disruptions for civilizations around the world. Others, like the 2.8 kiloyear event in the Iron Age were hardly noticed.
During the last glaciation, the Greenland ice core record documents rapid climatic change events called Dansgaard-Oeschger events or “D-O events.” 10 These are very rapid warming events, followed by slower cooling, that occur in a cycle of roughly 1,470 years +- 12%. 11,12 These events are probably the glacial period equivalent of the Bond events. In modern times, the cooling period, which is slower to develop, is more noticeable than the warming, because the cooling (and the droughts that accompany the cooling) seem to cause more disruption of civilization. Warming events tend to coincide with man’s better times, since they are associated with more precipitation and more abundant plant life. At the beginning of a D-O event, temperatures increase rapidly, perhaps 8 degrees C over 40 years as they did at the end of the Younger Dryas period. A more normal D-O event warming period is about 5 degrees C over 40 years. The cooling period after a D-O event normally lasts a few hundred years. Although most of the evidence for D-O events is from the Greenland ice cores, some have suggested that they are global events 13. These events can also be seen in Antarctic ice cores, but they are more subtle.
The Bond Event/D-O Event cyclicity is probably happening, it is well documented. But, no cause for this cyclicity has been found. Some have suggested that the Little Ice Age was the cold part of a D-O/Bond event. 14
Sea Level
Moving just to the right of The Last Glacial Maximum map on the lower left of the poster, you can see an artist’s (Robert Rohde) rendition of the rise in global eustatic sea level after the glaciers started melting. The data used to make the graph is from numerous sources listed in the referenced web site. 15 The earliest well documented evidence of human civilization dates to the middle of the most rapid rise in sea level in this period, roughly 12,000 years ago at Gobekli Tepe, Turkey. 16,17 From 14,000 years ago until 7,500 years ago sea level rose an astonishing 1.5 cm/year on average. This is almost 5 feet per 100 years. According to the University of Colorado Sea Level Research Group, the current rate of sea level rise is about 6.8 inches per 100 years or 3.2 mm per year. 18
Earliest evidence of civilization
The earliest evidence of large scale construction by man is found in Gobekli Tepe (near Urfa in southern Turkey). This site is roughly 300 meters by 300 meters and contains intricately carved stones. It is 12,000 years old and predates Stonehenge and the earliest Egyptian pyramids by over 7,400 years. Construction at Gobekli Tepe began during the Younger Dryas19 “Big Freeze.” The Younger Dryas was a sudden and short lived (geologically speaking, the Younger Dryas cold period lasted over 1,000 years) return of very cold weather, similar to the cold that existed in the Last Glacial Maximum. The Gobekli Tepe site is composed of multiple circular stone monuments; the tallest pillars in these monuments are 16 feet high and weigh over seven tons. The rings are 65 feet across and probably have religious significance. Construction of the site appears to have occurred during a hiatus in the sea level rise between 11,000 and 12,000 years ago. Then the site was mysteriously and deliberately buried around 10,000 years ago. The reasons for its construction and later burial are not known. But, one can probably safely speculate that it was buried to protect and preserve it. This task was accomplished and it is remarkably well preserved for its age.
Gobekli Tepe is the earliest religious monument known and also the earliest major construction project. It is interesting that the wild wheat that grows in the area is the closest relative, genetically, to modern domestic wheat. One can speculate that the early religious fervor that caused Gobekli Tepe to be built, may have inspired farming 2. After all, the construction of the religious monument would have required a number of people to live in one spot for a long time, they could not migrate in search of food, so it may have occurred to them to grow their own food.
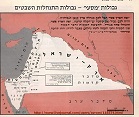
The earliest evidence of large scale organized agriculture is seen in the Levant region of the Middle East in present day Syria and Israel. 21. This occurred about 13,000 years ago in the middle of a very wet climatic time (Late Glacial Interstadial) that went from 13,500 years into the Younger Dryas “Deep Freeze,” which began around 12,800 years ago. Precipitation decreased during the Younger Dryas and increased after its end 11,500 years before present. There are also some preserved pottery fragments from 13,000 years ago in Japan and perhaps even older 20. Others have reported that pottery existed in China 20,000 years ago 22. The pottery from 20,000 years ago probably did not belong to farmers, but hunter/gatherers. It is possible that rice was farmed in China 13,900 years ago and in India 10,000 years ago 34.
Between 13,000 and 14,000 years ago a lot seemed to happen at various archaeological sites in the Middle East, buildings improved, villages got larger and were more advanced. But, they were mostly abandoned as temperatures got cooler at the beginning of the Younger Dryas. This cool period lasted over 1,000 years and the climate was very dry. Few advances in human civilization happened in the period, people were just trying to survive2. This is evident as the late Natufians, who lived during the Younger Dryas period, were in much poorer health (fewer teeth, often with caries) than the earlier Natufians from the Late Glacial Interstadial period. Further, the animal bones in their garbage dumps held bones of smaller animals than the earlier period. Both the animal herds and the human population were of smaller size 2.
According to many archaeologists, Homo floresiensis, a species of human often called the “Hobbit” man, survived until around 12,500 years ago before dying out in Indonesia 23. This was the last species of man to become extinct. Recent archaeological finds may indicate that Homo floresiensis was not a separate species, but just a variant of Homo sapiens.
Larger Cities
The Middle Eastern Neolithic B culture began around 10,800 years ago according to Kathleen Kenyon24. It is a significant period in the history of human civilization because at this time man became more dependent upon domesticated animals and organized large scale farming. Oddly, it has also been found that the earliest Indian agriculture appears to have been in the Indus valley around 11,000 years ago. 34. Also, in the Levant region, man began building larger settlements, rectangular buildings and organized communities. Plaster and pottery are first seen in Middle East at this time. The period may have begun when people migrated to the Levant from the Black Sea area8. The period ended with the 8,200 year BP event or Bond climatic event 57, this was another sudden cold period that affected civilization worldwide and caused massive migrations of people in search of food and water 25,8. During this event, over a period of 20 years, temperatures cooled, roughly, 3.3°C. It was not as severe as the Younger Dryas, but still significant. It only lasted a total of 200 to 400 years.
During the Neolithic B period evidence of relatively large settlements is found. Catalhoyak, a city of 8,000, existed near present day Cumra Konya, Turkey. This is a large, relatively modern “city” that existed 9,700 years ago 27,43,44,2.
Jericho is often considered the world’s oldest continually occupied city 26. Remains of early settlements, probably not cities, but villages of 500 people or so, in Jericho have been dated to 11,600 years ago2. The first woven cloth known was found in Ofer Bar-Yosef, Israel. It is around 10,000 years old, it was found with bone shuttles that were used to weave the cloth2. The cloth was a type of linen and not cotton, cotton was developed later in India.
8.2 Kiloyear Bond Event and the Great Floods
Just before the 8,200 year cold event, around 8,400 years ago, the Black Sea, which was a fresh water lake at the time, filled from Mediterranean Sea 8,2. This event is only the most recent of many catastrophic flooding events due to the melting of the glaciers after the LGM. The Baltic Sea, was a lake until 9,200 years ago, when it was finally connected to the Atlantic Ocean. These flooding events and , perhaps others, due to rising sea level are probably the cause of multiple “Great Flood” stories that populate early writings like the Noah’s Flood story in the Bible and Torah and the older Gilgamesh story 28.
Writing
Simple writing appears in Jiahu, China around 9,200 years ago 30 and in Tartaria, Romania around 7400 years ago 29. Whether either is true writing or not is a subject of debate, the symbols on the Tartaria tablets have not been translated and may be a “picture” story. The Chinese writing has some symbols that are similar to modern Chinese writing symbols. Because Chinese writing is not phonetic, it is hard to tell where “picture writing” stops and true modern writing begins.
True writing has been discovered from 5,600 years ago in Syria in the Uruk period 33. By this time very large cities existed and the city of Uruk had over 50,000 people in it 32. The Uruk period was characterized by large scale urbanization, irrigation, roads and canals. It may have begun as early as 6,200 years ago. The end of the Uruk period of the Sumer civilization coincided with the end of the Holocene Thermal Optimum a period of warm weather with a lot of precipitation and a very green world.
5.9 Kiloyear Bond Event
About 5,900 years ago the Sahara became a desert (The 5.9 kiloyear event or Bond event 4) and this very severe drought also ended the Ubaid empire and caused a huge migration of people from the Sahara region in search of food and water 35. The people migrated to river valleys, such as the Nile Valley in Egypt, in order to be close to water. Claussen, et al., 1999 36 has suggested that this drought was caused by a severe cooling event that occurred at the same time. The Sahara never recovers from this event. But, since the drought forces people into river valleys, larger cities are built and societies become more complex.
Following the end of the 5.9 kiloyear event and the end of the Holocene Thermal Optimum, around 4,500 years ago the earliest Egyptian pyramids are built, Stonehenge is constructed 37 in present day England and the first large cities appear in India38. The earliest Mayan cities appear a little over 600 years later around 3,900 years ago 39.
4.2 Kiloyear Bond Event
The 4.2 kiloyear event was a very cool period in the Arctic (the Bond Event 37) and it caused a very severe drought in the Middle East. This period caused a sudden collapse of the Egyptian government 40, famines and social disorder. Similar disruptions occurred in the Akkadian Empire 41, the Indus Valley and in China 42.
Around 3,300 years ago, the great Bronze Age civilizations in the Middle East collapsed. These included the Mycenaean’s, the Hittites and the Egyptian New Kingdom 43. This sudden collapse was probably caused by another extended and severe drought. The onset of this drought coincides with a sudden and extended cooling period in the Central Greenland ice core data. In general, most large scale droughts in the last 18,000 years appear to be associated with cooling in the Arctic. This marks the end of the Minoan Warm Period.
Iron Age
Starting 3,300 years ago, there seems to be a hiatus in the development of Middle Eastern civilization and not much happens until around 2,400 years ago with the beginning of the Roman Warm Period. This is just after the time of the Shang Dynasty (3,600-3,050 years BP), which is a very well documented period in China. The last capital of the Dynasty was at Yin and the Yin Dynasty is synonymous with the second half of the Shang dynasty.
The preceding Xia Dynasty was from 4,070-3,600 years before present. This part of Chinese history is very poorly documented and some historians wonder if it existed at all. It remains very poorly understood and barely documented 44.
Mayan settlements begin to appear about 4,700 years ago in Belize. The first well established Mayan cities (or large settlements) are dated to 3,600 years ago in Soconusco, Mexico 46. This is near the beginning of the cold period in the Iron Age. However, evidence of a true Mayan civilization does not appear until 2,900 years ago. The first written Maya history dates to 2,350 years BP. This is also the time of the first large scale cities and significant intellectual and artistic development. This is roughly the time when Rome emerged as a major power in the Mediterranean.
Roman Warm Period
Once we reach the beginning of the Roman Warm Period, roughly 2,400 to 2,200 years ago, robust civilizations have developed in the Americas, around the Mediterranean, China and India. By the time Alexander invaded India (2,339 years ago) they had a very advanced civilization. Very advanced cities were built in India beginning 4,100 years ago, but history is not well established until around 2,400 years ago. This warm period truly marks the beginning of modern civilization, written records document all major events since this time. Writings at this time suggest that the temperatures during the Roman Warm Period were comparable to temperatures today 47.
Normally the end of the Roman Warm Period is given as around 450 AD (1,563 years ago) and the Central Greenland temperature cooled by about one degree C in 200 years, it reaches the maximum drop of 1.4°C by 1,206 years ago or around 800 AD, the height of the Dark Ages in Europe.
Medieval Warm Period
The Medieval Warm Period is normally given as 950 AD to 1250 AD or 1063 years BP to 763 years BP. In the beginning of this period, temperatures in Central Greenland rose by 1.5°C in less than 200 years. This has been fairly well documented as a worldwide event 48. It is uncertain what the global average temperature was during the period and whether the world as a whole was warmer than now, or not. But, certainly in areas where we have records, such as Greenland, the UK, and in China, temperatures were comparable to temperatures today and in some cases warmer. A considerable amount of recent research attempts to compare temperatures during the Medieval Warm Period to today on a global basis 48.
Little Ice Age
The Little Ice Age was not a true ice age, but the cooler period after the end of the Medieval Warm Period. It is generally considered to have started by 1350 AD (663 years BP) 49 and it pretty much ended by 1850 AD (163 years BP) 50. In Central Greenland, temperatures drop about 1.5°C from 964 years BP to 597 years BP, which is a significant drop. It was not cold over the entire period, but the Little Ice Age saw many periods that were very cold, from the famous year without a summer (1816) to the great famine of 1315, New York Harbor completely froze over in 1780, the Norse colonies in Greenland starved and were abandoned in the 1400’s 51.
Modern Warm Period
The Modern Warm Period starts around 1850, which is also the time when people began systematically recording and collecting air temperature data from around the world. These temperatures were spotty in the beginning, but by the middle of the 20th Century a fairly good worldwide temperature database was developing 54. Finally, in 1979, satellites were launched that could give us a reasonably accurate and complete temperature record over the entire globe 52. In the poster, on the lower right, both datasets are shown. The satellite dataset is from UAH MSU 53. This is the best data to use, since it is global and has minimal editing. It shows warming of 0.35°C over the period from 1979 to the present. This is not particularly significant by historical standards.
The period from 1850 to 1979 is not as well documented globally and the records used to construct the global temperature average have had to undergo significant editing, which raises doubts about the accuracy of the record. But, the curves are shown for the Northern Hemisphere, the Southern Hemisphere and the whole globe on the lower right of the poster. These are made from the HADCrut dataset 54. They show a warming of about one deg. C in a period of 163 years. This is also not unusual by historical standards. Fluctuations of a degree C, either warmer or cooler, are very common in the historical record. Over this length of time warming of over 13°C was seen at the end of the Younger Dryas period in the Central Greenland ice core. In the same core, the beginning of the Holocene Thermal Optimum period saw a warming of five degrees C.
Conclusions
In general, the best times for man in the last 18,000 years are the warmer periods. The times of the disruption of civilization are the cooler and more arid times. This is quite consistent and since we have not seen unusual warming in the present warm period, relative to other warming events in the last 18,000 years, it seem doubtful that this warming period will be a problem for man to adapt to. Much of the last 18,000 years is characterized with much more rapid sea-level rise than we see today and this has caused a lot of disruption as it will in the future. But, the current rise in sea level is very slow relative to sea level rise during most of man’s civilized period. Our current warming and the current rate of sea level rise are very unspectacular.
In the words of Professor Steven Mithen, 2003 in “After the Ice Age...” (page 507)
“The next century of human-made global warming is predicted to be far less extreme than that which occurred at 9600 BC. At the end of the Younger Dryas, mean global temperature had risen by 7°C in fifty years, whereas the predicted rise for the next hundred years is less than 3°C. The end of the last ice age led to a 120 meter increase in sea level, whereas that predicted for the next fifty years is a paltry 32 centimeters at most,…”
___________________________________________________________________________________
Andy May is a Petrophysicist residing in The Woodlands, Texas
___________________________________________________________________________________
Bibliography for “Climate and Human Civilization over the last 18,000 years”
1. Clark, Dyke, Shakun, Carlson, Clark, Wohlfarth, Mitrovica, Hostetler, McCabe, “The Last Glacial Maximum,” Science 7, August 2009, Vol 325, No. 5941, pp. 710-714.
2. Mithen, Steven (2003), “After the ice: a global human history, 20,000 to 5,000 BC.," Cambridge Ma., Harvard University Press.
3. Wu, Zhang, Goldberg, Cohen, Pan, Arpin, Bar-Yosef, 2012, Science, Vol. 336, No. 6089, P 1696-1700.
4. Vinther, Buchardt, Clausen, Dahl-Jensen, Johnsen, Fisher, Koerner, Raynaud, Lipenkov, Andersen, Blunier, Rasmussen, Steffensen, Svensson, “Holocene thinning of the Greenland ice sheet,” Nature, Vol 461, September, 2009.
5. Petit J.R., Jouzel J., Raynaud D., Barkov N.I., Barnola J.M., Basile I., Bender M., Chappellaz J., Davis J., Delaygue G., Delmotte M., Kotlyakov V.M., Legrand M., Lipenkov V., Lorius C., Delmotte M., Kotlyakov V.M., Legrand M., Lipenkov V., Lorius C., Pépin L., Ritz C., Saltzman E., Stievenard M., 1999, Climate and Atmospheric History of the Past 420,000 years from the Vostok Ice Core, Antarctica, Nature, 399, pp.429-436.
6. Alley, Richard, “The Younger Dryas cold interval as viewed from Central Greenland, Quaternary” Science Reviews, Vol. 19, Jan. 2000, p 213-226 http://www.ncdc.noaa.gov/paleo/pubs/alley2000/
7. Bond, Showers, Cheseby, Lotti, Almasi, deMenocal, Priore, Cullen, Hajdas, Bonani, 1997, “A Pervasive Millennial-Scale Cycle in North Atlantic Holocene and Glacial Climates” Science 278 p. 1257–1266)
8. Ryan and Pittman, “Noah’s Flood: The New Scientific Discoveries about the Event That Changed History,” 1998, Simon and Schuster.
9. deMenocal, Peter, 2001, “Cultural Responses to Climate Change During the Late Holocene,” Science 292, p 667-673.
10. http://www.ncdc.noaa.gov/paleo/abrupt/data3.html
11. Schulz, M. (2002). “On the 1470-year pacing of Dansgaard–Oeschger warm events” Paleoceanography17
12. Rahmstorf (2003). “Timing of abrupt climate change: A precise clock” (PDF). Geophys. Res. Lett. 30 (10): 1510.
13. Voelker, Antje, 2002, “Global distribution of centennial-scale records for Marine Isotope Stage (MIS) 3: a database” Quaternary Science Reviews 21: 1185-1212
14. Bond, et al., 1999, “The North Atlantic’s 1–2 kyr climate rhythm: relation to Heinrich events, Dansgaard/Oeschger cycles and the little ice age” in Clark, P.U., Webb, R.S., Keigwin, L.D., Mechanisms of Global Change at Millennial Time Scales (PDF). Geophysical Monograph (112). American Geophysical Union
15. Rohde, Robert, http://www.globalwarmingart.com/wiki/Image:Post-Glacial_Sea_Level.png
16. http://www.smithsonianmag.com/history-archaeology/gobekli-tepe.html
17. http://en.wikipedia.org/wiki/G%C3%B6bekli_Tepe
18. http://sealevel.colorado.edu/
19. http://www.ncdc.noaa.gov/paleo/abrupt/data4.html
20. http://arthistoryworlds.org/pottery-of-ancient-japan/
21. http://www.columbia.edu/itc/anthropology/v1007/baryo.pdf
22. Wu, et al., “Early Pottery at 20,000 years ago in Xianredong Cave,” Science, 2012
23. Morwood, Soejono, 2004, “Archaeology and Age of a new hominin from Flores in eastern Indonesia,” Nature, 431, p 1087-1091.
24. http://en.wikipedia.org/wiki/Pre-Pottery_Neolithic_B
25. http://www.ncdc.noaa.gov/paleo/abrupt/data5.html
26. http://www.telegraph.co.uk/travel/picturegalleries/6242644/The-worlds-oldest-cities.html?image=19
27. http://www.catalhoyuk.com/downloads/Archive_Report_2012.pdf
28. George, A. R., The Babylonian Gilgamesh Epic, Oxford University Press.
29. Haarman, H, 1990, “Writing from Old Europe”, The Journal of Indo-European Studies.
30. Rincon, Paul, 2003, “Earliest Writing in China,” BBC News
31. Li, X, Harbottle, Garman, Zhang, Wang, “The Earliest writing? Sign use in the seventh millennium BC at Jiahu, Henan Province, Chinese” Antiquity 77, p. 31-44
32. http://www.metmuseum.org/toah/hd/uruk/hd_uruk.htm
33. http://oi.uchicago.edu/OI/MUS/ED/TRC/MESO/writing.html
34. Gupta, A., 2004, “Origin of agriculture and domestication of animals linked to early Holocene climate amelioration,” Current Science, 87, Indian Academy of Sciences.
35. Parker, Adrian, 2006, “a Record of Holocene climate change from lake geochemical analyses in southeastern Arabia,” Quaternary Research 66, p. 465-476.
36. Claussen, et al., 1999, “Simulation of an Abrupt Change in Saharan Vegetation in the Mid-Holocene,” Geophysical Research Letters 26-14.
37. Morgan, et al., 2008, “Dig Points Stonehenge origins,” BBC
38. Fagan, Brian, 2003, “People of the Earth: An Introduction of world prehistory,” Pearson, 414 p.
39. Hammond, et al., 1976, “Radiocarbon chronology for early Maya occupation at Cuello, Belize,” Nature 260, 579-581.
40. Stanley, 2003, “Nile Flow Failure at the end of the Old Kingdom, Egypt: Strontium isotopic and petrologic evidence,” Geoarchaeology 18 395-402.
41. Kerr, 1998, “Sea Floor Dust Shows Drought Felled Akkadian Empire,” Science, 16 Vol. 279, no. 5349 p325-326.
42. Chun, et al., 2011, “Extraordinary floods related to the climatic event at 4200 BP,” Quaternary Science Reviews 30 460-468.
43. Langer, 1972, An Encyclopedia of World History, Houghton-Mufflin
44. http://globalheritagefund.org/onthewire/blog/catalhoyuk_world_heritage_list
45. Israel Finklestein http://www.nytimes.com/2013/10/23/world/middleeast/pollen-study-points-to-culprit-in-bronze-era-mystery.html
46. Liu and Xiu, “Rethinking Erlitou: legend, history and Chinese archaeology”, Antiquity, 81:314 (2007) p 886-901
47. Pletcher, Kenneth, “The History of India,” in print, Britannica Publishers, 341 pages
48. Clark and Blake, 1994, “The Power of Prestige: Competitive Generosity and the Emergence of Rank Societies in Lowland Mesoamerica,” Cambridge University Press.
49. Bianchi, and McCave, 1999, “Holocene periodicity in North Atlantic climate and deep-ocean flow south of Iceland,” Nature 397, 515-517.
50. http://www.co2science.org/data/mwp/mwpp.php
51. Miller, et al., 2011, “Abrupt onset of the Little Ice Age triggered by volcanism and sustained by sea-ice/ocean feedbacks,” Geophysical Research Letters
52. IPCC AR4, “Solar Variability and the Total Solar Irradiance,” Chap. 1
53. http://en.wikipedia.org/wiki/Little_Ice_Age#cite_note-6
54. Rao, Smith and Koffler, “Global Sea-Temperature Distribution Determined Froma an Environmental Satellite,” Monthly Weather Review, Vol 100, No. 1
55. http://www.drroyspencer.com/latest-global-temperatures/
56. http://www.cru.uea.ac.uk/cru/data/temperature/
57. Veizer, J., Ala, D., Azmy, K., Bruckschen, P., Buhl, D., Bruhn, F., Carden, G.A.F., Diener, A., Ebneth, S., Godderis, Y., Jasper, T., Korte, C., Pawellek, F., Podlaha, O. and Strauss, H., 1999. 87Sr/86Sr, d13C and d18O evolution of Phanerozoic seawater. Chemical Geology 161, 59-88.) is that of Harland et al.(1990) A Geological Time Scale 1989, Cambridge University Press
___________________________________________________________________________________
Article published here: Watts Up With That?
URL: http://www.a-w-i-p.com/index.php/2013/11/19/climate-and-human-civilization-over