


Cosmic Ray Decreases Affect Atmospheric Aerosols and Clouds
Henrik Svensmark, Torsten Bondo and Jacob Svensmark

Close passages of coronal mass ejections from the sun are signaled at the Earth’s surface by Forbush decreases in cosmic ray counts. We find that low clouds contain less liquid water following Forbush decreases, and for the most influential events the liquid water in the oceanic atmosphere can diminish by as much as 7%. Cloud water content as gauged by the Special Sensor Microwave/Imager (SSM/I) reaches a minimum ≈7 days after the Forbush minimum in cosmic rays, and so does the fraction of low clouds seen by the Moderate Resolution Imaging Spectroradiometer (MODIS) and in the International Satellite Cloud Climate Project (ISCCP). Parallel observations by the aerosol robotic network AERONET reveal falls in the relative abundance offine aerosol particles which, in normal circumstances, could have evolved into cloud condensation nuclei. Thus a link between the sun, cosmic rays, aerosols and liquid-water clouds appears to exist on a global scale.
1. Introduction
Explosive events on the sun provide natural experiments for testing hypotheses about solar influences on the Earth. A conspicuous effect is the sudden reduction, over hours to days, in the influx of galactic cosmic rays (GCRs), first noticed by Scott E. Forbush in 1937. Such Forbush decreases (FDs) are now understood to be the result of magnetic plasma clouds from solar coronal mass ejections that pass near the Earth and provide a temporary shield against GCRs [Hilary, 2000]. Whether or not any consequences of these events are perceptible in the weather has been a subject of debate for 50 years [Ney.1959; Dickinson, 1975; Tinsley, 2008]. Recent attention has focused on the question of whether an effect on clouds due to changes in atmospheric ionization by GCRs is observable [Svensmark and Friis-Christensen, 1997; Marsh and Svensmark, 2000; Kniveton,2004; Todd and Kniveton, 2004; Harrison and Stephenson 2006], or is not observable [Kristjnsson and Kristiansen, 2000; Sloan and Wolfendale, 2008; Kristjnsson et al., 2008]. Here we report clear signals of changes both in the liquid water content of the Earth’s low clouds and the relative abundance of fine atmospheric aerosols, during the days that follow the FDs.
2. Ranking Forbush decreases by their low altitude effects
An important preliminary step in the present work is to distinguish quantitatively between ”strong and ”weak FDs, by calculating changes in ionization in the atmosphere due to each FD. Because we are concerned with clouds in the lower atmosphere, we choose as the reference the average ionization below 3 km altitude during the period for which cloud water data are available, 1987-2007. From responses to an FD in about 130 neutron monitors world wide and the Nagoya muon detector, the changes in the primary cosmic ray spectrum at 1 AU are derived. This procedure, and the subsequent Monte Carlo simulations of ionization by cosmic ray showers, are explained in the supporting onlinematerial.
Table 1. [see below] lists the strongest FDs, 1987-2007. The first and second columns give the numerical order and the dates of the Forbush minima in the daily averaged GCRs. The third column is the strength of the FD, defined by the change in the ionization at the minimum, relative to a base period 14 days before the minimum. The value of the ionization decrease is normalized to be relative to the variation in ionization during the solar cycle at a latitude of 45 deg. On average the solar cycle variation in GCR ionizationis 10 -15 % below 6 km altitude [Bazilevskaya et al., 2008].
3. Responses to FDs in liquid water clouds and aerosols
Three independent sources of satellite data on liquid water clouds are used to explore responses to FD events. The Special Sounder Microwave Imager (SSM/I) [Wentz,1997; Weng et al., 1997] observes changes in the cloud liquid water content (CWC) over the world’s oceans. The Moderate Resolution Imaging Spectroradiometer (MODIS) on NASA’s Terra and Aqua satellites (land and oceans) gives the liquid water cloud fraction (LWCF). The International Satellite Cloud Climate Project (ISCCP) [Rossow and Schiffer, 1991] provides data on IR detection of low clouds (less than 3 .2 km) over the oceans. Substantial declines in liquid water clouds, apparently tracking the declining cosmic rays and reaching minima some days after the GCR minima, were readily detectable for the strongest events in Table 1., whether considered individually or in superpositions of several events.
To investigate a possible mechanism, we use observational data on aerosols in the atmosphere as monitored by the solar photometers of the AERONET program, with many stations well distributed over the globe. The relative blocking of sunlight of different wave-lengths is given by the Angstrom exponent a in the aerosol extinction law, τ(λi) = τ1λi−α,where τ(λi) is the aerosol optical thickness at a given wavelength λiand τ1 is the approximate optical thickness at a wavelength of 1 micron. In the case of measurements at two wavelengths λ1 and λ2 the fitted exponent α1,2 provides information about the relative abundance of fine aerosols. Long wavelengths respond to their volume fraction, whilst short wavelengths are sensitive to the effective radius of the fine mode (< 250 nm) aerosol [Schuster et al. 2006].
The left hand panel in Figure 1. [see below] averages the AERONET data and GCR data for the five strongest FDs in the period covered by AERONET from 1998 onward (order numbers 1, 3, 4, 6, and 7 in Table 1.). A rapid decrease in the Angstrom exponent for 340 nm and 440 nm closely follows the GCR decline, leading to a minimumabout 5 days after the Forbush minimum, and is consistent with an increase in the effective radius of the fine mode due to a progressive decline in the abundance of the smallest particles among the fine mode aerosols, or, equivalently, their enhanced removal to larger particles. The second panel in Figure 1. superposes the SSM/I data for CWC for the same five FD events. Notice that the CWC minimum occurs 4 days later than the fine aerosol minimumin the AERONET plot, as might be expected if an aerosol change precedes cloud changes, and if there is no appreciable transport time between the region in which changes occur and the sampling region. The third and fourth panels in Figure 1. plot observations of the LWCF from MODIS, and low oceanic clouds from ISCCP, superposed for the same events.
4. Clouds and aerosols in many FD events
The robustness of FD effects on the Earth’s lower atmosphere was tested by using the events in Table 1. to see how the responses vary with the strength of the FD. To start with the upper left panel of Figure 2. [see below], each data point was obtained by first filtering the CWC data from SSM/I using a Gaussian of width 2 days and total length of 10 days, to reduce fluctuations. Then the minimum of the filtered curve was identified in the interval day 0 to day 20 after the FD minimum. The CWC minimum was rated as the percentage drop relative to a base level given by the average level on days -15 to -5 before the FD minimum, whilst the uncertainty was defined as the variance of the residuals between the filtered and the unfiltered CWC. The resulting 26 data points plotted in Figure 2. (upper left) reveal the relation between strength of the FD events and the corresponding minima in CWC.
Two other independent data sets on liquid water clouds were tested in the same way: LWCF from MODIS, matched to 13 events 2000-2007 (upper right in Figure 2.), and low IR clouds from ISCCP for 26 events 1987-2007 (lower left). In the lower right panel of Figure 2., the aerosol data from AERONET go through the same analysis, with 17 events 1998-2007. In all four cases, the blue regression lines suggest that the minima in clouds or fine aerosols deepen with increasing FD strength. The slopes differ from zero at the 0.95 significance level (linear regression with subsequent t-test). Using Monte Carlo simulations with random dates instead of the FD dates the distribution of slopes showed that the FD slopes are all signifcant at the 0.95 level, except for MODIS, where the slope is significantat the 0.92 level.
5. Discussion
The scatters of cloud data in Figure 2., and the lengths of the error bars, show how meteorological noise can easily mask the signal of the cloud response to FD events [Voiculescu et al., 2006]. This is probably why some previous investigators did not detect the full meteorological impact of FDs, and offered their negative results as evidence against the reported link between cosmic ray flux and low cloud cover. For example, Sloan and Wolfendale [2008] used the ISCCP data, for which the error bars are particularly large. For MODIS the error bars are smaller, but while we select only 13 FDs in the period 2000-2007, Kristjnsson et al. [2008] used about 22 FDs.
As a result their data were dominated by weak FDs that would be plotted to the left of our data in Figure 2. (upper right panel), in a region where uncertainties due to variations in meteorology are much greater than the FD signal. The observed change in aerosols (Figures 1. and 2.) can be related to the drop in CWC and LWCF by a loss of the fine aerosols <250 nm that in normal circumstances would have grown into cloud condensation nuclei of ≈0.5 µm. Some models of aerosol growth have suggested time scales of the order of several days [Russell et al., 1994; Arnold, 2006].
There is observational and experimental evidence that cosmic rays facilitate the formation of ultrafine 10-30 nm sulfuric acid aerosols within a few hours, (in the experiment andobservations over land close to the surface the condensable vapour concentrations are typically higher than the corresponding values over the oceans, and as a result a fastergrowth rate). [Kulmala et al., 2004; Svensmark et al., 2007]. These particles (initially too small to be seen by AERONET) then slowly grow into CCN during the course of some days, mainly by recruiting condensable vapors [Russell et al., 1994]. Our aerosol results can be interpreted as a reduction in the nucleation of ultrafine aerosols, leading to a progressive reduction in CCN that shows up indirectly in the changes in CWC and LWCF about a week after the GCR minimum.
Observations are strongly divided on the influence of aerosols on CWC, mainly because meteorological as well as microphysical conditions are involved. Nevertheless, theoretical models suggest that CWC should increase with CCN [Ackerman et al., 2004], in agreement with the present observation.
In contrast the LWCF is less ambiguous [Ackerman et al., 2004], where an increase in CCN results in an increase in droplet number and a decrease in droplet size, resulting in less drizzle, longer cloud lifetime, and an increase in cloud fraction. The response in CWC for the larger events is of the order 7%. For an FD strength of 100 % in Figure 2. the change in cloud fraction (ISCCP and MODIS) is of the order 4% ±2% which is slightly larger than the changes observed during a solar cycle of ≈2% [Marshand Svensmark, 2000].
Our study further indicated that other solar phenomena related to the coronal mass ejections, including changes in total solar irradiance (TSI) or UV and X-ray bursts from flares, are not well correlated with the strength of FDs. A radically different interpretation of meteorological responses to FDs [Tinsley, 2008] invokes effects of the downward ionosphere-earth current density (Jz). Impacts of FDs on winter storm vorticity were reported by Tinsley and Deen [1991], and when Todd and Kniveton [2004] examined ISCCP cloud data for 32 FDs (1983-2000) and noted immediate reductions of high level cloud (especially over the Antarctic plateau in winter) Tinsley [2008] interpreted these changes as correlating with Jz. Such processes might conceivably affect cloud water content and aerosol concentrations several days later, but our analysis neither detects nor excludes a role for the Jz mechanism.
6. Conclusion
Our results show global scale evidence of conspicuous influences of solar variability on cloudiness and aerosols. Irrespective of the detailed mechanism, the loss of ions from the air during FDs reduces the cloud liquid water content over the oceans. So marked is the response to relatively small variations in the total ionization, [that] we suspect that a large fraction of Earth’s clouds could be controlled by ionization. Future work should estimate how large a volume of the Earth’s atmosphere is involved in the ion process that leads to the changes seen in CCN and its importance for the Earth’s radiation budget. From solar activity to cosmic ray ionization to aerosols and liquid-water clouds, a causal chain appears to operate on a global scale.
Acknowledgments
We thank Professor H. Spliid for valuable discussions regarding the statistics, and HS thanks Nigel Calder for helpful comments.
SSM/I data are produced by Remote Sensing Systems and sponsored by the NASA Earth Science REASoNDISCOVER Project. Data are available at www.remss.com.
We thank the Principal Investigators and staff of AERONET http://aeronet.gsfc.nasa.gov for establishing and maintaining the sites used in this investigation. The ISCCP D1 data were obtained from the International Satellite Cloud Climatology Project web site http://isccp.giss.nasa.gov.
References
Ackerman, A. S., M. P. Kirkpatrick, D. E. Stevens, and O. B. Toon (2004), The impactof humidity above stratiform clouds on indirect aerosol climate forcing, Nature, 432, 1014-1017, doi:10.1038/nature03174.
Arnold, F. (2006), Atmospheric aerosol and cloud condensation nuclei formation: Apossible influence of cosmic rays?, Space Science Reviews, 125, 169-186.
Bazilevskaya, G. A., I.G. Usoskin, E.O. Flckiger, R.G. Harrison, L. Desorgher, R.Btikofer, M.B. Krainev, V.S. Makhmutov, Y.I. Stozhkov, A.K. Svirzhevskaya, N.S.Svirzhevsky, and G.A. Kovaltsov (2008), Cosmic ray induced ion production in the atmo-sphere, Space Science Reviews, 137, 149-173.
Dickinson, R. E. (1975), Solar variability and the lower atmosphere, Bulletin of theAmerican Meteorological Society, 56, 1240-1248.
Harrison R.G, and D.B. Stephenson (2006), Empirical evidence for a nonlinear ef-fect of galactic cosmic rays on clouds, Proc. R. Soc. London A. 462, 12211233,doi:10.1098/rspa.2005.1628.
Kniveton, D. R. (2004), Precipitation, cloud cover and Forbush decreases in galacticcosmic rays, Journal of Atmospheric and Solar-Terrestrial Physics, 66, 1135-1142, doi:10.1016/j.jastp.2004.05.010.
Kristjnsson, J. E., and J. Kristiansen (2000), Is there a cosmic ray signal in recentvariations in global cloudiness and cloud radiative forcing?, J. Geophys. Res., 105(D9),11,851-11,863.
Kristjnsson, J. E., C. W. Stjern, F. Stordal, A. M. Fjraa, G. Myhre, and K. Jnasson(2008), Cosmic rays, cloud condensation nuclei and clouds: a reassessment using MODISdata, Atmos. Chem. Phys., 8, 7373-7387.
Kulmala, M., H. Vehkamki, T. Petj, M. Dal Maso, A. Lauri, V. M. Kerminin, W.Birmili, and P. H. McMurry (2004), Formation and growth rates of ultrafine atmosphericparticles: a review of observations, J. Aerosol Sci., 35, 143-176.
Marsh, N. D., and H. Svensmark (2000), Low cloud properties influenced by cosmicrays, Phys. Rev. Lett., 85, 5004-5007.
Ney, E. R. (1959), Cosmic radiation and the weather, Nature, 183, 451-452.
Rossow, W. B., and R. A. Schiffer (1991), ISCCP cloud data products, Bulletin of theAmerican Meteorological Society, 72, 2-20.
Russell, L. M., S. N. Pandis, and J. H. Seinfeld (1994), Aerosol production and growthin the marine boundary layer, J. Geophys. Res., 99(D10), 20,98921,003.
Schuster, G. L., O. Dubovik, and B. N. Holben (2006), Angstrom exponent and bimodalaerosol size distributions, J. Geophys. Res., 111, D07207, doi:10.1029/2005JD006328.
Sloan, T., and A. Wolfendale (2008), Testing the proposed causal link between cos-mic rays and cloud cover, Environ. Res. Lett., 3, 024001. (6pp) , doi: 10.1088/1748-9326/3/2/024001
Svensmark, H., and E. Friis-Christensen (1997), Variation of cosmic ray flux and globalcloud coverage - a missing link in solar-climate relationships, Journal of Atmospheric andSolar-Terrestrial Physics, 59, 1225-1232.
Svensmark, H., J. O. P. Pedersen, N. D. Marsh, M. B. Enghoff, and U. I. Uggerh?j(2007), Experimental evidence for the role of ions in particle nucleation under atmosphericconditions, Proc. R. Soc. London A, 463 (2078), 385-396, doi. 10.1098/rspa.2006.1773.
Tinsley, B. A. (2008), The global atmospheric electric circuit and its ef-fects on cloud microphysics, Reports on Progress in Physics, 71 (6), 066,801-+,doi:10.1088/00344885/71/6/066801.
Tinsley, B.A., and G.W. Deen (1991), Apparent tropospheric response to Mev-Gevparticle flux variations: a connection via electrofreezing of supercooled water in high-levelclouds?, J. Geophys. Res., 96, 22,283-22,296.
Todd, M. C., and D. R. Kniveton (2004), Short-term variability in satellite-derived cloudcover and galactic cosmic rays: update, Journal of Atmospheric and Solar-TerrestrialPhysics, 66, 1205-1211.
Voiculescu, M., I. G. Usoskin, and K. Mursula (2006), Different response of clouds tosolar input, Geophys. Res. Lett., 33, 21,802-+, doi:10.1029/2006GL027820.
Weng, F., N. Grody, R. Ferraro, A. Basist, and D. Forsyth (1997), Cloud liquid waterclimatology from the Special Sensor Microwave/Imager. J. Climate, 10, 1086-1098.
Wentz, F. J. (1997), A well-calibrated ocean algorithm for SSM/I, J. Geophys. Res.,102(C4) 8703-8718.

Table 1. Twenty-six solar events in the period 1987-2007 are here ranked according to their depression of ionization in the Earth’s lower atmosphere, gauged as a percentage of the normal overall variation in ionization during the course of a solar cycle (set to 100%). The dates givenare those of the minima of the Forbush decreases (FD) reported from neutron monitors. Thebold dates are the FD for which AERONET data are available, with the earliest occurring in1998. In general the FD were chosen for their strength, so only FD with reduction larger than7% in the South Pole neutron monitor (cutoff rigidity 0.06 GV) were selected. Three events13-27 October 1989 were omitted, because they were so close in time that they interfered withone another, and were also interspersed with large ground level events.
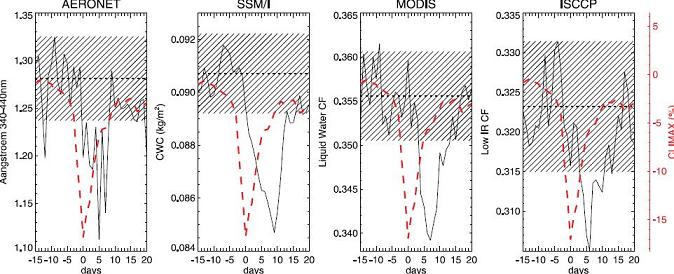
Figure 1. The evolution of cloud water content (SSM/I), liquid water cloud fraction (MODIS),and low IR-detected clouds (ISCCP) is here averaged for the 5 strongest Forbush decreases thattheir data sets have in common (order numbers 1, 3, 4, 6, and 7 in Table 1), and is compared withthe corresponding evolution of fine aerosol particles in the lower atmosphere (AERONET). Inthe AERONET plot each data point is the daily mean from about 40 AERONET stations world-wide, using stations with more than 20 measurements a day. The broken horizontal lines denotethe mean for the first 15 days before the Forbush minimum, and the hatched zones show ±1 σfor the data, estimated from the average variance of a large number of randomly chosen periodsof 36 days of each of the four data sets. The effects on clouds and aerosols are not dominated by any single event among the 5 averaged. Examples of SSM/I data for several individual events are shown in the supporting online material.

Figure 2. Quantitative comparison of effect of the Forbush Decrease magnitude in each ofthe four data sets. The number of events shown depends on the longevity of each data set:26 FDs for cloud water content (SSM/I), 13 FDs for liquid water cloud fraction (MODIS), 26FDs for low IR cloud fraction, below 3.2 km altitude (ISCCP), and 13 FDs for fine aerosolparticles (AERONET). The blue line in each is a weighted linear fit to the data. The slopes areall significantly different from zero (at 0.95 level), and so confirm a stronger decrease in liquidwater clouds and in fine aerosols for a stronger FD. The delay τ until the minimum followingthe FD minimum and regression coefficients (y = A + Bx) are for SSM/I τ = 7.9 ± 6.0 days andA = −0.69±0.69 and B = −0.061±0.012 , for MODIS τ = 7.8±5.2 days and A = 0.16±1.37 andB = −0.051±0.023, for ISCCP τ = 10.9±6.7 days and A = 0.37±0.98 and B = −0.058±0.017,and for AERONET τ = 6.9 ± 6.5 days and A = 8.21 ± 3.49 and B = −0.20 ± 0.059.
___________________________________________________________________________________
Photo: AFP PHOTO/NASA
Source: Geophysical Research Letters
URL: http://www.a-w-i-p.com/index.php/2010/02/10/decreases-in-cosmic-rays-affect-athmosph